Forecasting for the Energy Sector
W&CSs span a wide range of forecasting lead (or horizon) times, from very short-term (seconds or several minutes ahead), short-term (day ahead), mid-term (week to month ahead), and long-term (years to decades ahead) temporal scales. There is a close link between forecast accuracy and the extent of area covered, for example short term predictions (nowcasting) can be usually performed for areas between 0.1 to 10 km (WMO SG-Ene, 2022, Figure 1). This broad span of forecasting horizons has been developed to respond to information requirements for various applications, not only for the energy sector. However, they are also germane to different elements of the energy system, with operations (e.g. power load forecasting) requiring very short to short-term forecasting, and planning new renewable power plants benefitting from climate projections.
As the time window of the forecast increases, so does the uncertainty in the predictions, as errors propagate through time iterations. Thus, ensembles (generated by a single model) are normally used to represent errors in the model and in the initial conditions. In doing so, the forecast skill generally increases, especially beyond the time horizon of a few/several days when predictability of a deterministic model reduces. Model combinations are useful to increase forecast skill too.

Figure 1. Main features for different forecasting lead times, from nowcasting to climate projections (numbered from 1, top, to 6, bottom). For each lead time the three bars represent: a. temporal lead times, b. spatial scales, and c. source of predictability. GHG stands for greenhouse gases. Source: WMO SG-Ene, 2022.
From an energy sector user (e.g. grid operator) perspective there are several areas served by W&CSs:
- Historical data. Characterisation of past weather/climate events using historical data. Perhaps this is the most important element, as it provides a baseline, or first order approximation, of the current risks and opportunities for RE energy development. Reanalysis of historical data is done through statistical and Numerical Weather Prediction (NWP) methods to fill gaps in historical data.
- Nowcasting/short term weather forecasts. From seconds to days, these forecasts are useful for load balancing by maximising the usable component of the generated power. Important for stable grid operation, day-ahead operational management of reserve power and economic dispatch planning.
- Sub-seasonal to seasonal climate forecasting. From one to several months, these forecasts are useful for maintenance planning of infrastructure and resource and risk management purposes, power trading strategy, and long-term weather variability affecting generation and detecting exposure of utilities to potential hazards.
- Decadal climate forecasting. Useful for multi-year resource risk management; these forecasts effectively extend the seasonal forecast range to typically ten years ahead thus allowing to have a longer risk assessment horizon of weather variability affecting generation and detecting exposure of utilities to potential hazards. Also useful for planning and evaluating resource availability and potential energy demand through Adequacy Assessments and upgrading of wind farms or photovoltaic power plants that have been built.
- Multi-decadal climate projections. Useful for infrastructure risk assessment and corresponding weather proofing. This includes providing authoritative data on possible evolution of climate considering different emission scenarios, including those aligned with policies. Investment and planning through RE resources estimations so that they provide optimized locations for wind and solar energy farms.
The production of weather and climate information (in the form of data, visualisation, briefing documents) that underpins the services for the energy sector is ultimately based on the simulation of the Earth system or relevant components. Simulating the Earth system involves extremely complex technology, using a set of NWP methods in combination of other statistical and machine learning methods which have been developed over many decades (WMO, 2022). The type of models used will depend on the time period that needs to be predicted.
Additionally, energy conversion models are defined as the models which link meteorological and energy variables since energy system components are more or less sensitive to weather and climate. These models can be either statistical or physical or a combination of both approaches. On one end of the spectrum, there is thermal generation, including nuclear, which need W&CSs to predict water temperature used for cooling. At the other end of the spectrum, wind and solar PV generation are mainly controlled by wind speed, solar radiation and air temperature, even if also other factors, as with any energy system, such as power system failures, maintenance downtime, etc. affect the amount of power generated by these technologies (WMO SG-ENE, 2022).
One of the most common conversion models is the (simplified) wind power curve. This curve is normally expressed as an analytical function (Figure 2) even if in practice there is a lot of scatter between wind speed and wind power when actual measurements are plotted against one another (Figure 3). A practical use of the wind power curve can be seen in Figure 4, where the wind power density, useful for planning new power plant developments, has been computed for Croatia.
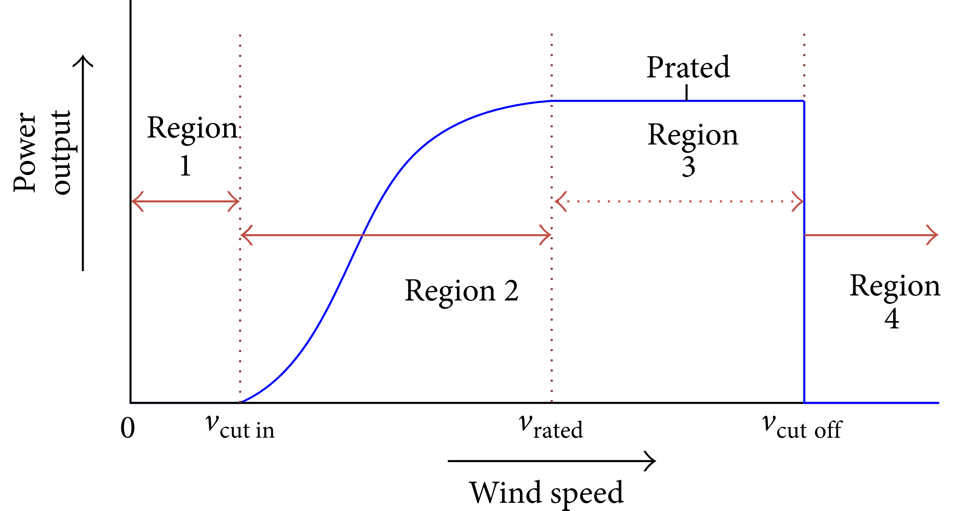
Figure 2. Typical power curve of a wind turbine (Sohoni et al. 2016).
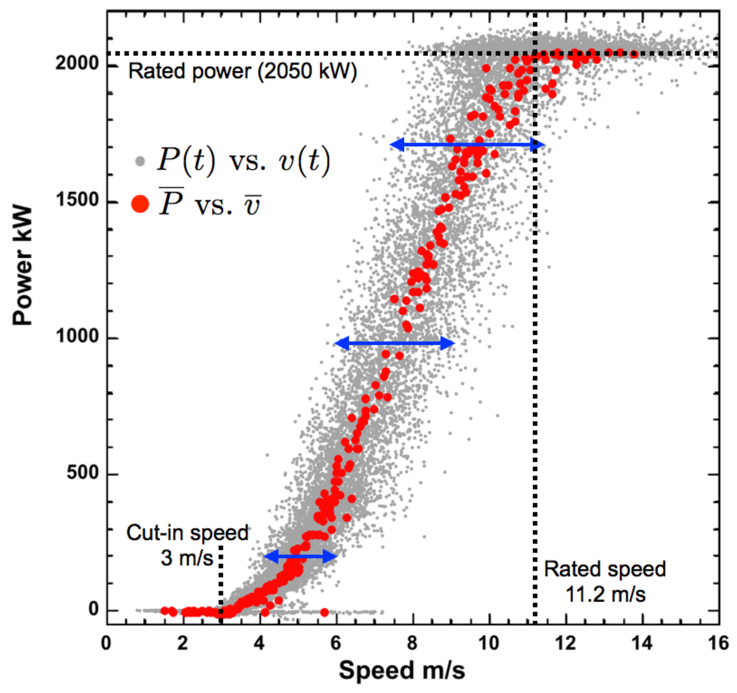
Figure 3. Instantaneous power versus instantaneous wind speed (solid grey circles) and time-averaged power versus time-averaged wind speed (solid red circles) (Bandi and Apt et al. 2016).
Figure 4. Mean annual power density (W/m2) 80 m above ground level for Croatia, showing potential opportunities for development of wind farms using 1992 -2001 historical data. Source: DHMZ
It is important to rigorously evaluate the forecast methods and to be aware of the limitations of the NWP-based forecasting, especially by sudden changes in weather such as the passage of small-scale cumulus and wind ramp patterns. Failure of RE forecasting by such inherent variations in wind and sunlight makes an enormous impact on the power grid. In many cases, mean values of forecasting error are crucial to prevent power generation failure and grid breakdown.
Various statistical measures have been proposed for weather and climate models, but not all of them are suitable for RE uncertainty estimation from the operational point of view (Messner et al., 2020). There is a need to develop RE-oriented statistical measures to link forecast uncertainty with operators and markets (Messner et al., 2020). Additionally, sophisticated platforms to provide RE forecasting and their uncertainty are currently available mostly for western countries only.
Environmental effects of massive renewable power plants.
As solar and wind installations are becoming more common a new field of research is emerging, which is trying to understand how these RE power plants can affect the local weather. Effects can be positive or negative depending on the context. Massive wind farms increasingly extract kinetic energy from the atmosphere, thus impacting its energy resource. New research is trying to understand this phenomenon, aiming to establish limits to wind energy potentials (e.g. 1 W m2 of surface area for wind farms with downwind lengths of more than 100 km). To estimate these, some methods have been developed like the Kinetic Energy Budget of the Atmosphere (KEBA), which can be used to assess regional wind energy resource potentials that account for the depletion of wind speeds (Kleidon and Miller, 2020). Similarly, there is research aiming to understand how massive installations of PV panels can affect the weather by changing the albedo (namely the proportion of radiation reflected from a surface), which, for example, could have a substantial impact on rainfall. Calculations for the Red Sea found that the large installations of solar panels on the coastal plains could change the albedo to 0.2, increasing surface air temperature by 1–2 K° thus intensifying the sea-land temperature gradient, which in turn intensify breezes that enhance water vapor vertical mixing, potentially generating 1.5 Gt of extra rainwater (Mostamandi et al, 2022). Nevertheless, caution needs to be taken to use this for geoengineering, as the above two examples show, atmospheric dynamics are complex, and modifying one element can trigger a cascade of events; rain in one region may imply lack of rain in another location, or rain can come in the form of thunderstorms causing flash-floods.

Photo: Noor Abu Dhabi Solar Power Plant with 938 MW, installed capacity in the United Arab Emirates. Source: Sentinel Hub. Contains modified Copernicus Sentinel data 2020
References
- WMO SG-Ene, 2022. Energy conversion models and forecasting, In: Guidelines of the WMO Commission for Weather, Climate, Water and Related Environmental Services and Applications- Study Group on Integrated Energy Services, Integrated weather & climate services in support to net zero energy transition.
- The Kinetic Energy Budget of the Atmosphere (KEBA) model 1.0: a simple yet physical approach for estimating regional wind energy resource potentials that includes the kinetic energy removal effect by wind turbines Geoscientific Model Development, Volume 13, Issue 10, pp.4993-5005
- Messner, J.W., Pinson, P., Browell, J., Bjerregård, M.B., & Schicker, I. 2020. Evaluation of wind power forecasts- An up‐to‐date view. Wind Energy, 23, 1461-1481.
- Mostamandi, S., Predybaylo, E., Osipov, S., Zolina, O., Gulev, S., Parajuli, S., & Stenchikov, G. 2022. Sea Breeze Geoengineering to Increase Rainfall over the Arabian Red Sea Coastal Plains, Journal of Hydrometeorology, 23(1), 3-24.
- Vaishali Sohoni, S. C. Gupta, R. K. Nema, "A Critical Review on Wind Turbine Power Curve Modelling Techniques and Their Applications in Wind Based Energy Systems", Journal of Energy, vol. 2016, Article ID 8519785, 18 pages, 2016. https://doi.org/10.1155/2016/8519785
- Bandi, M.M.; Apt, J. Variability of the Wind Turbine Power Curve. Appl. Sci. 2016, 6, 262. https://doi.org/10.3390/app6090262