Hydropower Generation
Hydropower generation increased 124 TWh (+3%) in 2020, compared to 2019, reaching 4,418 TWh and remaining the largest renewable source of electricity, generating more than all other renewable technologies combined. After five consecutive years of decline, hydropower capacity additions rebounded in 2020 and reached 21 GW thanks to commissioning of several large power plants in China and Turkey (Bojek and Bahar, 2021). Figure 1 shows global hydropower generation installed capacity for 2021.
In the Net Zero Emissions by 2050 Scenario, hydropower maintains a 3% average annual generation growth rate between 2020 and 2030 to provide 5 870 TWh of electricity per year. To meet this level, an average 48 GW of new capacity should be connected to the grid annually during this period. Significantly stronger efforts, especially to streamline permitting and ensure project sustainability, are needed to achieve such strong capacity growth (Bojek and Bahar, 2021).
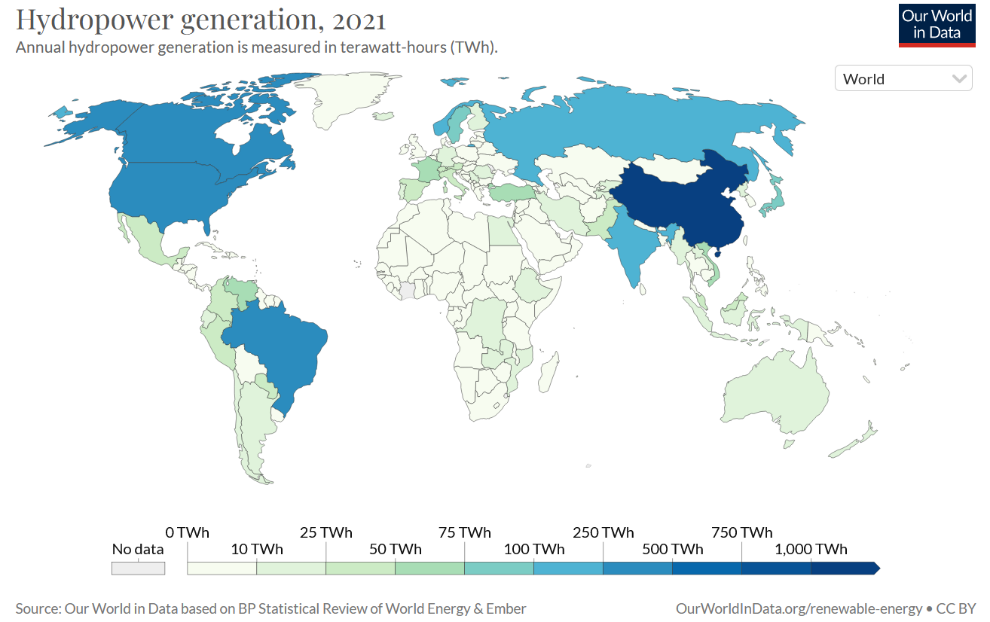
Figure 1. Global hydropower generation for 2021. Source: Our World in Data
Hydropower reliability, flexibility and energy storage capacity
Hydropower generation is the most reliable renewable source of energy. In case of blackouts affecting large areas, hydropower plants can help restart quickly and stabilize the grid, as they do not need an external power source to resume operations. In addition, they can quickly address peak demand. Plants with available water storage can accommodate variability from other energy sources and maintain voltage levels and frequencies within legal requirements across the grid. They can also help maintaining a constant power supply of hybrid grids. Pumped-storage hydropower systems can store energy – also in case of energy excess from other energy sources – by pumping water between lower and higher-elevated reservoirs, that can later be released to supply energy at moments of high demand (EREE, 2017).
Forecasting for hydropower generation
Hydropower generation can be classified in three main types: Run-of-river generation, dams/reservoirs and pumped hydropower. Run-of-river is the most dependent on weather and water variability of the three, followed by the reservoir type of production, which is in turn more dependent than pumped hydropower generation.
Forecasting for hydropower generation is more difficult than wind power as there are many more aspects affecting the river discharge levels, which can be grouped into land features and meteorological conditions (van der Wiel, 2022). Amongst the land features, there are:
- Surrounding topography
- Soil type and percentage of rock/hard surfaces exposed in the catchment
- Shape and size of the basin
- Location of the dam in the catchment (up/mountain or downstream/valley)
- Land use and vegetation cover
In terms of meteorological conditions relevant to hydropower generation, the following variables need to be considered:
- Precipitation amount and precipitation pattern
- Temperature
- Snow fall, snowpack, snow melt
- Evaporation rate
- Soil moisture availability
- Subsurface moisture
However, approximate estimations of hydropower production can also be achieved through the use of temperature and precipitation alone.
With climate change, besides changes in mean conditions, also the frequency and intensity of extreme hydrological events such as storms, droughts and floods are projected to change. In some regions of the world there has been a steady decrease in generation by hydropower plants due to reduced precipitation. More specifically, it has been estimated that under a high emission scenario (RCP8.5) the usable capacity of hydropower plants is projected to globally reduce by 61–74% (van Vliet et al, 2016).
In addition, there are other pressures on water demand due to population growth, economic growth, and technological change (Aghajani and Ghadimi, 2018). Importantly water is also needed for ecosystems health and function. Climate change may affect agricultural, industrial, energy and urban water use and demand, and in some cases may put high stress in the water share for all these sectors. This makes it harder to estimate the overall contribution of hydropower generation to the energy mix in the future for a given basin/country, as water allocation is typically done yearly by governments to comply with the demands of all sectors and this allocation in turn relies on forecasts.
River runoff models
There exist several models to estimate runoff, which can be classified broadly in two ways, according to the model structure (Table 1, Figure 3) or according to the spatial interpretation of the model’s catchment area (Table 2). Models can be classified broadly as empirical, conceptual, and physical, as arranged by the model structure (Sitterson et al., 2018). Different criteria are used to classify and divide models based on spatial resolution, input/output type, model simplicity, etc. There is another classification based on the spatial interpretation of the model’s catchment area. This separates models into lumped, semi-distributed, and distributed models. Choosing a rainfall-runoff model is based on the modelling purpose such as understanding and answering specific questions about the hydrological process; assessing the frequency of runoff events; or estimating runoff yield for management purposes (Vaze, 2012).
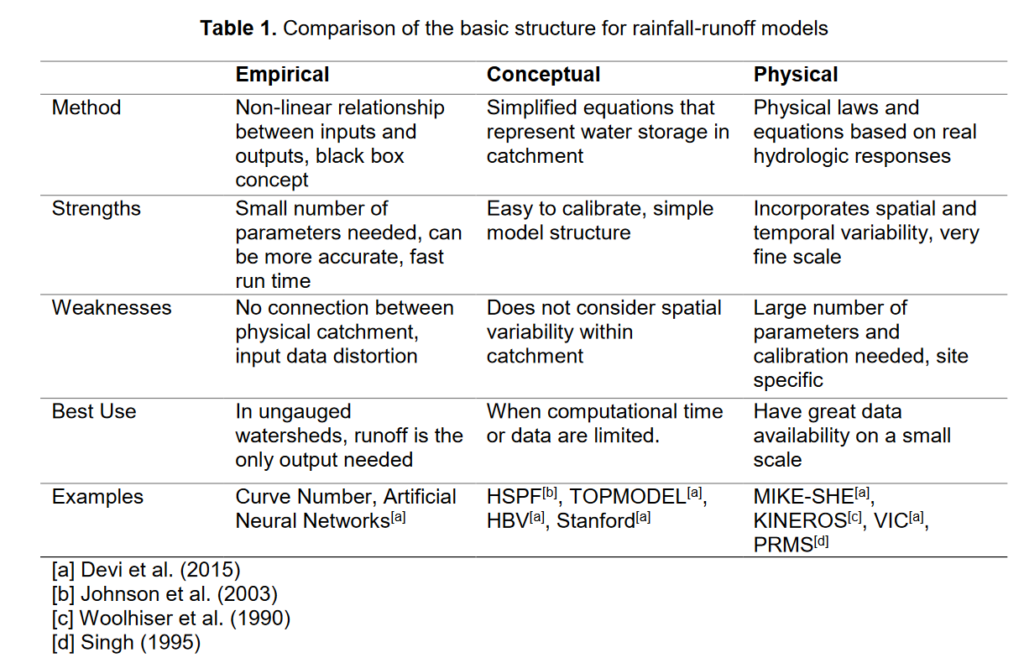
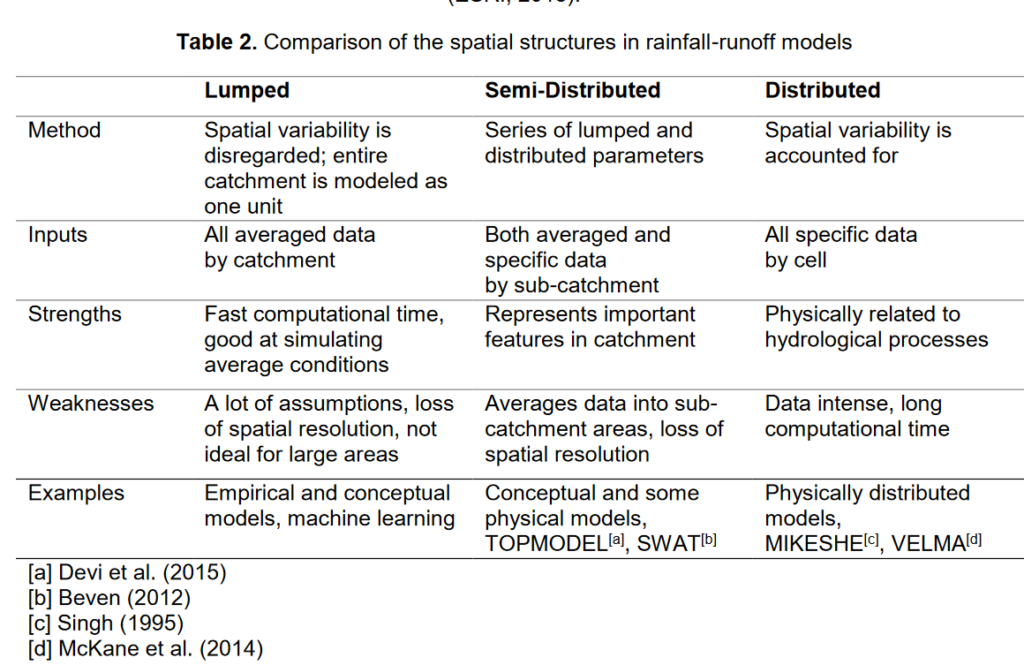
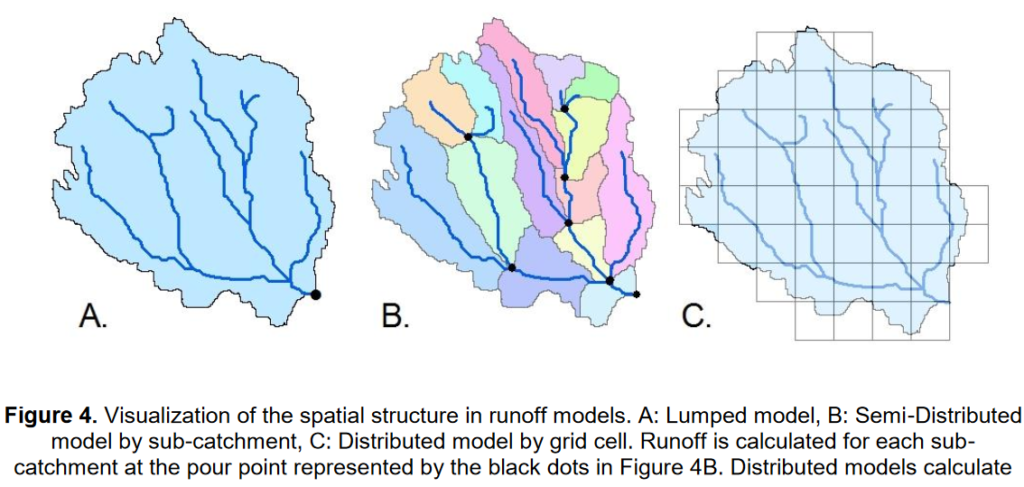
Figure 3. Visualisation of the three spatial structure runoff models: A. Lumped model, B. Semi-distributed model by sub-catchment, C. Distributed model by grid cell. For lumped and semi-distributed models the runoff is calculated at the pour point indicated by black dots, whereas for distributed models runoff is calculated for each grid cell (Source: Sitterson et al., 2018).
Forecasting hydropower
Traditionally water availability has been forecasted using both statistical methods and physical modelling, however with climate change affecting virtually all variables used for prediction like snowfall, rainfall, snow melt and evaporation, the accuracy of the statistical models is reduced. However, ground-based data, combined with remote sensing data, machine learning, and data assimilation techniques for hydrologic models, can improve both hydrologic simulations (model training) and forecasting (Guo et al 2021).
In many cases there is more than one dam in a hydropower system, so generation of the entire system needs to be modelled using river runoff forecast as initial input. The release from an upstream reservoir then becomes an input to the immediate downstream reservoir. The water head is determined by both inflow and water release of that reservoir. The water head and the volume of water released will determine generation.
An enhanced forecasting method for a single hydropower system can consist of three steps:
- Spatially distributed Wireless Sensor Networks (WSNs) measuring key parameters, like temperature, precipitation, relative humidity, snow depth, and soil moisture
- Spatial maps which make use of remote sensing and machine learning based on in-situ measurements and
- Enhanced (physical or statistical) hydrologic forecasting model.
However, if the objective is to ensure a stable energy supply, particularly at the country scale, understanding the effect of climate on hydropower generation can be done with statistical models, for instance at the country level (e.g. Ho et al. 2020, who used a machine learning method, the random forest model, to produce a publicly accessible hydropower dataset for European countries).
Value of forecasting
Establishing an observation station or network, such as a WSN, can be initially costly but in the long term it is a worthwhile investment. In one study where a WSN was installed for a whole hydropower system (Father river basin, USA, 6 reservoirs and 9 powerhouses) the skill scores of the enhanced forecasting method were higher than the statistical method by 0.34 on average, which translated to a difference in Internal Return of Investment of around 30% when high and low electricity price scenarios over a year were considered (Guo et al., 2021).
References
- Aghajani, G. & Ghadimi, N. 2018. Multi-objective energy management in a micro-grid.
- Aghajani, G. & Ghadimi, Energy Reports, 4: 218-225.
- Bojek, P. and Bahar, H. 2021. Hydropower. Tracking report. International Agency of Energy (IEA).
- EREE. 2017. 4 Reasons why hydropower is the guardian of the grid. Office of Energy Efficiency & Renewable Energy, U.S. Department of Energy.
- Ho, L.T.T., Dubus, L., De Felice, M., Troccoli, A., 2020: Reconstruction of multidecadal country-aggregated hydro power generation in Europe based on a random forest model. Energies 2020, 13, doi: 10.3390/en13071786.
- Sitterson, J., Knightes, C., Parmar, R., Wolfe, K., Avant, B., and Muche, M. 2018. An Overview of Rainfall-Runoff Model Types. International Congress on Environmental Modelling and Software. 41.
- van der Wiel, K., Wanders, N., Selten, F. M., and Bierkens, M. F. P.: Added value of large ensemble simulations for assessing extreme river discharge in a 2 ∘C warmer world, Geophys. Res. Lett., 46, 2093–2102, https://doi.org/10.1029/2019GL081967, 2019.
- van Vliet, M.T.H., Wiberg, D., Leduc, S. & Riahi, K. (2016). Power-generation system vulnerability and adaptation to changes in climate and water resources. Nature Climate Change 6 (1), 375-381. 10.1038/nclimate2903.