Effects of Climate Change on Energy Systems
A recent review of the potential effects of climate change on energy systems under two different scenarios (below and above 2°C) found that for wind there will be a mild impact, the impact increases for solar and is particularly variable for hydro-generation, with some cases causing >40% reduction, whereas in others, almost a 50% increase (Figure 1) (Yalew et al., 2020).
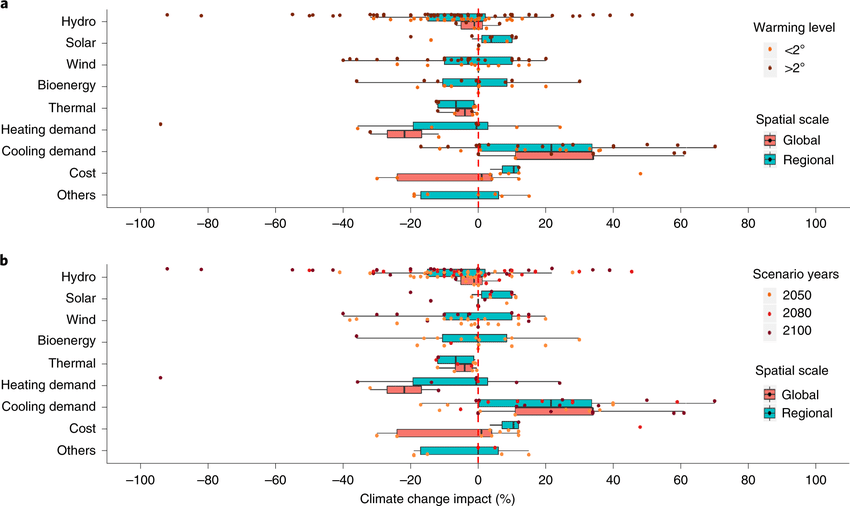
Figure 1. Climate change impacts on energy systems. (a) Impacts per future warming levels and (b) by scenario years/period, as reported by studies on global and regional spatial scales. The box plots display five quartiles. Dots represent individual studies, and boxes represent interquartile ranges. Dots outside the lines are statistical ‘outliers’. ‘Others’ denotes generic assessments and transport/transmission. Source: Yalew et al., 2020
A summary of identified effects that climate change has on the energy system is presented in Table 1.
| Climate Change Trends | Specific Parameter change | Generation | Transmission and Distribution | Demand | Nature based Solutions (NbS) |
|---|---|---|---|---|---|
|
Increase in Global Temperature |
Air Temperature Increase |
Generation efficiency Modest reduction in efficiency of solar PV modules. Cooling efficiency. Nuclear and thermal power plants. reduction in cooling systems by increased sea and river temperature, or ambient air temperature and/or relative humidity. Generation potential Decreasing hydropower potential due to increased evaporation losses from reservoirs. Shift in hydrological flows due to changes in precipitation type (e.g. snow to rain) and glacial melt. Need for additional generation capacity due to higher demand Additional generation capacity in systems with annual peak in summer. |
Reduced network efficiency Modest increase in network losses and line sag reducing available capacity (also dependent on other variables such as wind). Derating of T&D equipment. |
Cooling and heating
Increasing air-conditioning and refrigeration requirements. Decreasing space heating demand. |
Reforestation of utilities surroundings
to reduce regional temperature (Vegetation can reduce air temperature by up to 10C and stabilize wind gusts). |
|
Water
Temperature Increase
|
Cooling efficiency
Lower efficiency of thermal and nuclear plant technologies with water-based cooling due to the increasing temperature of cooling water. Generation potential Lower generation potential due to ecological constraints on water temperature being fed back into water bodies. |
|
|
Reforestation of riparian zones.
Reforesting up and downstream from the point of water intake/discharge from the plant. Increase meanders and ramifications of the streams to facilitate cooling. |
|
|
Changing patterns of Precipitation & Humidity |
Generation potential and output
Changing hydropower potential due to changing patterns of precipitation. Partial output reduction or complete shutdown of thermal plants due to insufficient availability of cooling water. Peak and variability Increasing variations in hourly or seasonal peaks of hydropower generation as a result of increased anomalies in precipitation patterns. Change in exceedance and shorter return periods of flash floods that can damage existing infrastructure, like dams and dikes. Technology application and development Constrained application of carbon capture, use and storage technologies where there is increased risk of water scarcity. |
Physical risks to grids
Damage to T&D assets due to direct or indirect impacts of heavy precipitation, such as intense rainfall, extreme snowfall, rock and tree falls and landslides. |
Cooling
Increasing air-conditioning load due to a rising level of humidity in hot weather. Electricity for water supply Higher electricity demand to provide drinking and irrigation water in cases of drought. |
|
|
|
Sea Level Rise |
Sea level rise |
Physical risks to generation assets
Threats to existing generation facilities in coastal areas. Locations for new assets Limited availability of appropriate locations for new generation. Tidal generation output Change in generation output with a faster tidal current resulting from sea level rise. |
Physical risks to grids
Increasing vulnerability to coastal erosion and floods, linked to substations often located near main generation plants and load centres in coastal areas. Locations for new assets Limited availability of appropriate locations for grid development. |
Electricity for water supply
Increasing cases of adopting more energy-intensive methods (e.g. desalination) to provide water due to saltwater intrusion. |
Active management of mangroves and marshlands, in combination with hard man-built structures like walls and dikes. |
|
Extreme Weather Events |
Heat waves |
Generation efficiency Reduced efficiency of solar PV modules and thermal power plants. |
Transmission efficiency
Substantial reduction in line capacity due to increased sag or cable capacity due to heat dissipation limitations. Derating of capacity to prevent transformer overload. De-energising lines to prevent potential fires. |
Cooling Substantial increase in demand due to air conditioning and refrigeration, intensified by the thermal inertia of buildings. |
|
|
Cold spells
&
Snow storms
|
Generation availability
Equipment failure Disruption of fuel supply. Icing of wind turbines rotors and blades |
Physical risk to grids
Damage to T & D equipment due to direct or indirect impacts such as extreme snowfall. Line sagging due to ice weight |
Heating
Substantial increase in demand due to electricity heating |
|
|
|
Storms and Cyclones |
Physical risks to generation assets
Physical damage producing power outages. Lightning strikes on wind turbine blades. |
Physical risks to grids
Damage to T&D lines due to flying debris, strong winds and corrosion due to saltwater. Power outage Faults caused by flooding of transformer and substations due to storm surges. |
|
Building with nature measures, including restoring and reforesting the floodplains, creation of river diversions and temporary water storage areas and restoration of marshy riverine landscapes. |
|
|
Wildfires |
Physical risks to generation assets Physical damage producing power outages. |
Physical risks to grids
Damage to T&D equipment due to direct or indirect impacts. Multiple short circuits. Loss of import/export of electricity. |
|
Maintenance of fire rides. Management of fire fuel, use abrupt changes in vegetation to change fire speed. |
|
|
Droughts |
Generation efficiency
Reduced efficiency or complete shutdown of hydro-generation and thermal and nuclear plants requiring water for cooling. |
|
Cooling.
Sometimes droughts are associated to hot spells that will increase energy demands. |
Reforestation of river catchments specially riparian areas upstream and downstream and management of water table levels. |
|
|
Floods |
Physical risks to generation assets
Physical damage of dams and generation plants. |
Physical risks to grids
Damage to T&D equipment due to direct or indirect impacts. |
Emergency response.
Increase of energy demand from hospitals and other critical infrastructure. |
Reforestation of surrounding areas upstream or in slops to increase water absorption, ground stabilisation and slowing flash floods speed. |
Sources: Adapted from EA, (2021), IEA (2015); IEA (2016); IEA (2018) ; EEA (2019); World Bank 2019); IPCC (2018); AEMO (2020b); CPUC (2020); Ebinger et al. (2011); Bierkandt et al (2015); and Moore (2010).
References
- AEMO 2020, ’Integrated System Plan’
- Bierkandt, R. Auffhammer, M., and Levermann, A. 2015. US power plant sites at risk of future sea-level rise. Environ. Res. Lett. 10 124022
- CPUC. 2020. Energy annual report. California Public Utilities Commission. Report. Ebinger, J., and Vergara, W. 2011. Climate Impacts on Energy Systems : Key Issues for Energy Sector Adaptation. World Bank. License: CC BY 3.0 IGO.
- EEA. 2019. Adaptation challenges and opportunities for the European energy system. Building a climate resilient low carbon energy system. EEA Report No 01/2019. European Energy Agency (EEA)
- IEA. 2015. India Energy Outlook 2015. World Energy Outlook Special Report. International Energy Agency (IEA)
- IEA. 2021. Climate Resilience Part of Electricity Security 2021 Report. International Energy Agency (IEA)
- IPCC. 2018. Global Warming of 1.5°C. An IPCC Special Report on the impacts of global warming of 1.5°C above pre-industrial levels. International Panel on Climate Change (IPCC)
- IPCC 6th Assessment. 2021. Climate Change 2021: The Physical Science Basis. Working Group I Contribution to the IPCC Sixth Assessment Report
- IPCC 6th Assessment, 2022. Climate Change 2022: Impacts, Adaptation, and Vulnerability. Contribution of Working Group II to the Sixth Assessment Report of the Intergovernmental Panel on Climate Change [H.-O. Pörtner, D.C. Roberts, M. Tignor, E.S. Poloczanska, K. Mintenbeck, A. Alegría, M. Craig, S. Langsdorf, S. Löschke, V. Möller, A. Okem, B. Rama (eds.)]. Cambridge University Press. In Press.
- Knutson, T., Camargo, S. J., Chan, J. C. L., Emanuel, K., Ho, C., Kossin, J., Mohapatra, M., Satoh, M., Sugi, M., Walsh, K., & Wu, L. (2020). Tropical Cyclones and Climate Change Assessment: Part II: Projected Response to Anthropogenic Warming, Bulletin of the American Meteorological Society, 101(3), E303-E322. WMO expert team project.
- NHC-CPHC. 2022. Tropical Storm Ian Wind Speed Probabilities. Report. National Hurricane Center and Central Pacific Hurricane Center, NOAA
- Yalew, S., van Vliet, M., Gernaat, D., Ludwig, F., Miara, A., Park, C., Byers, E., De Cian, E., Piontek, F., Iyer, G., Mouratiadou, I., Glynn, J., Hejazi, M., Dessens, O., Rochedo, P., Pietzcker, R., Schaeffer, R., Fujimori, S., Dasgupta, S., Vuuren, D. 2020. Impacts of climate change on energy systems in global and regional scenarios. Nature Energy. 5. 10.1038/s41560-020-0664-z.